Mok Drones is a desktop app designed to capture user-made inputs and display real-time data measurements for in-flight pilots. The goal was to create interfaces with a visual hierarchy that allowed for quick and easy access to digestible data. This was essential for pilots to make informed decisions during races and improve performance.
Objectives
- Show personalized quantitative data for individual pilots
- Stylized interface retaining the backbone of the brand
- Wireframing and prototyping, UX/UI design, information design
Results
- Modular and easy to read information for users and pilots
- Established brand presence with strong visual motifs
- Data organizing and established hierarchy of information
First pass wireframe
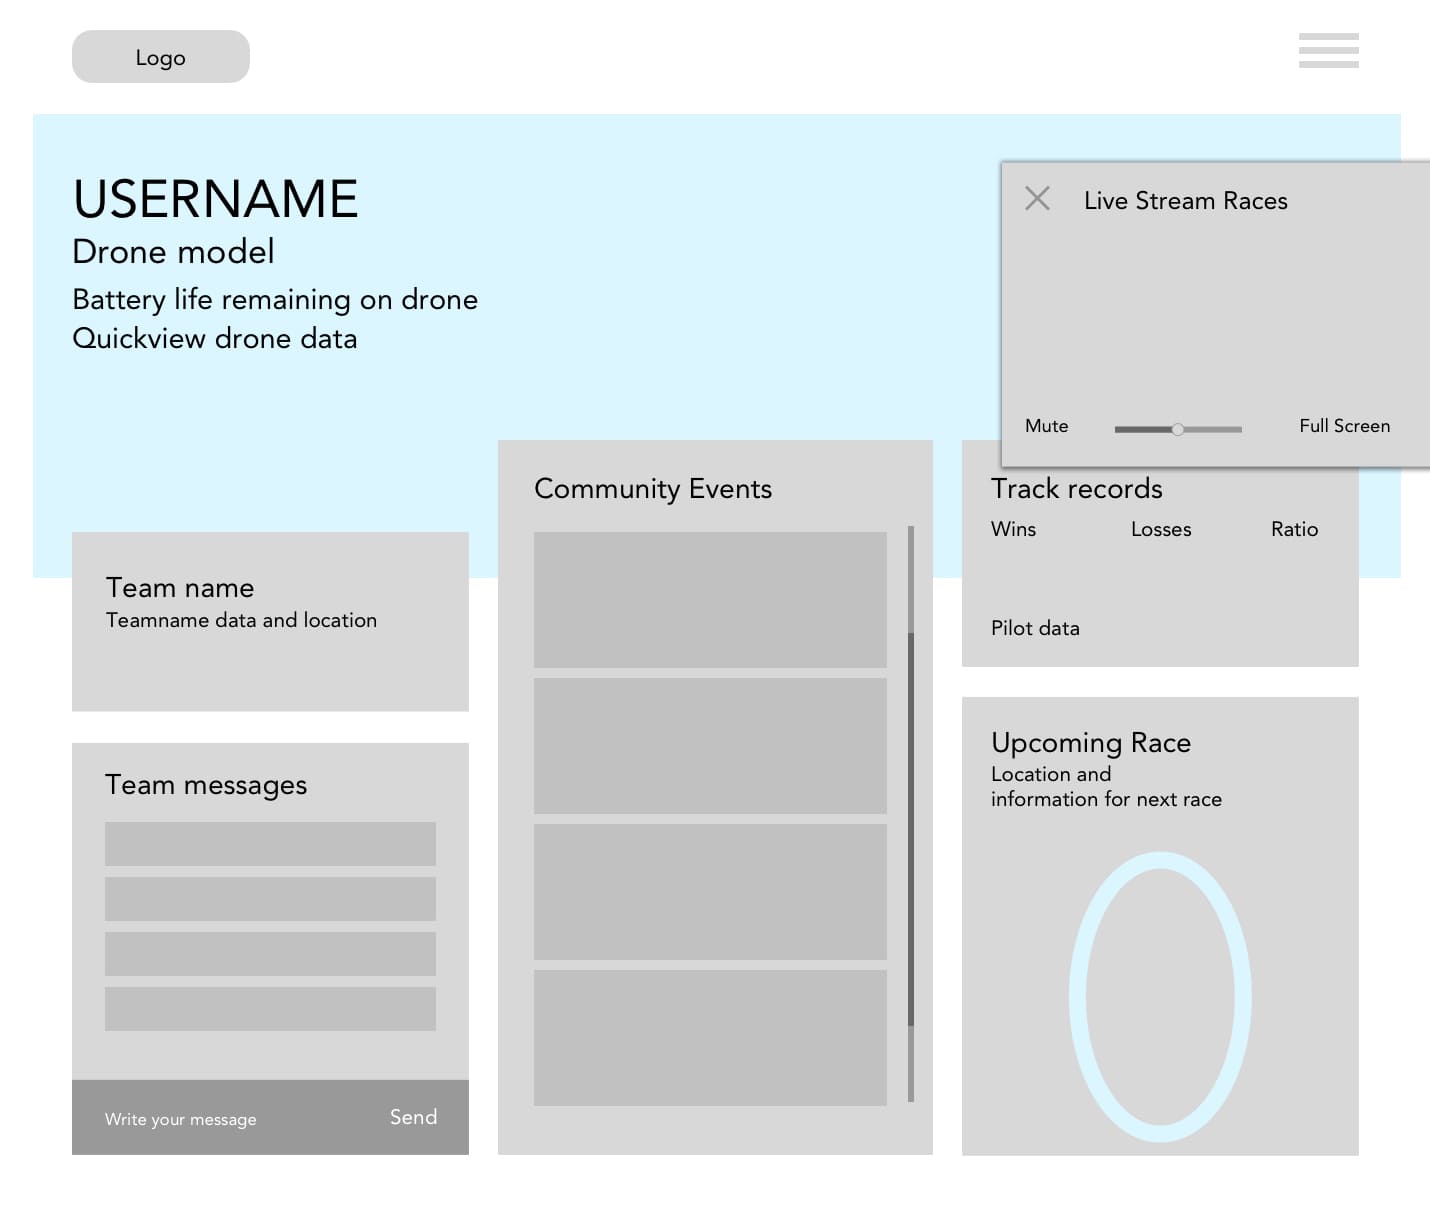
This was the initial layout of the wireframe for the home dashboard. One of the key challenges was to accommodate the information-packed screen, without losing the simplicity and ease of use in mind.
Establishing a three-column system was successful and became the foundation for the application as well as the typographic hierarchy.
The navigation had to be reconsidered because of the lack of a personalized experience for the end-users. Needed to be reapproached with a simplified navigation bar as well.
Stylized elements

Light streak: Inspired motifs from long exposure photography of drones flying as well as abstracted line graphs.

Geofencing Grid: Technical term used in professional drone racing where markers are placed and established as checkpoints and boundaries.
Micro Animations

Finalized wireframe
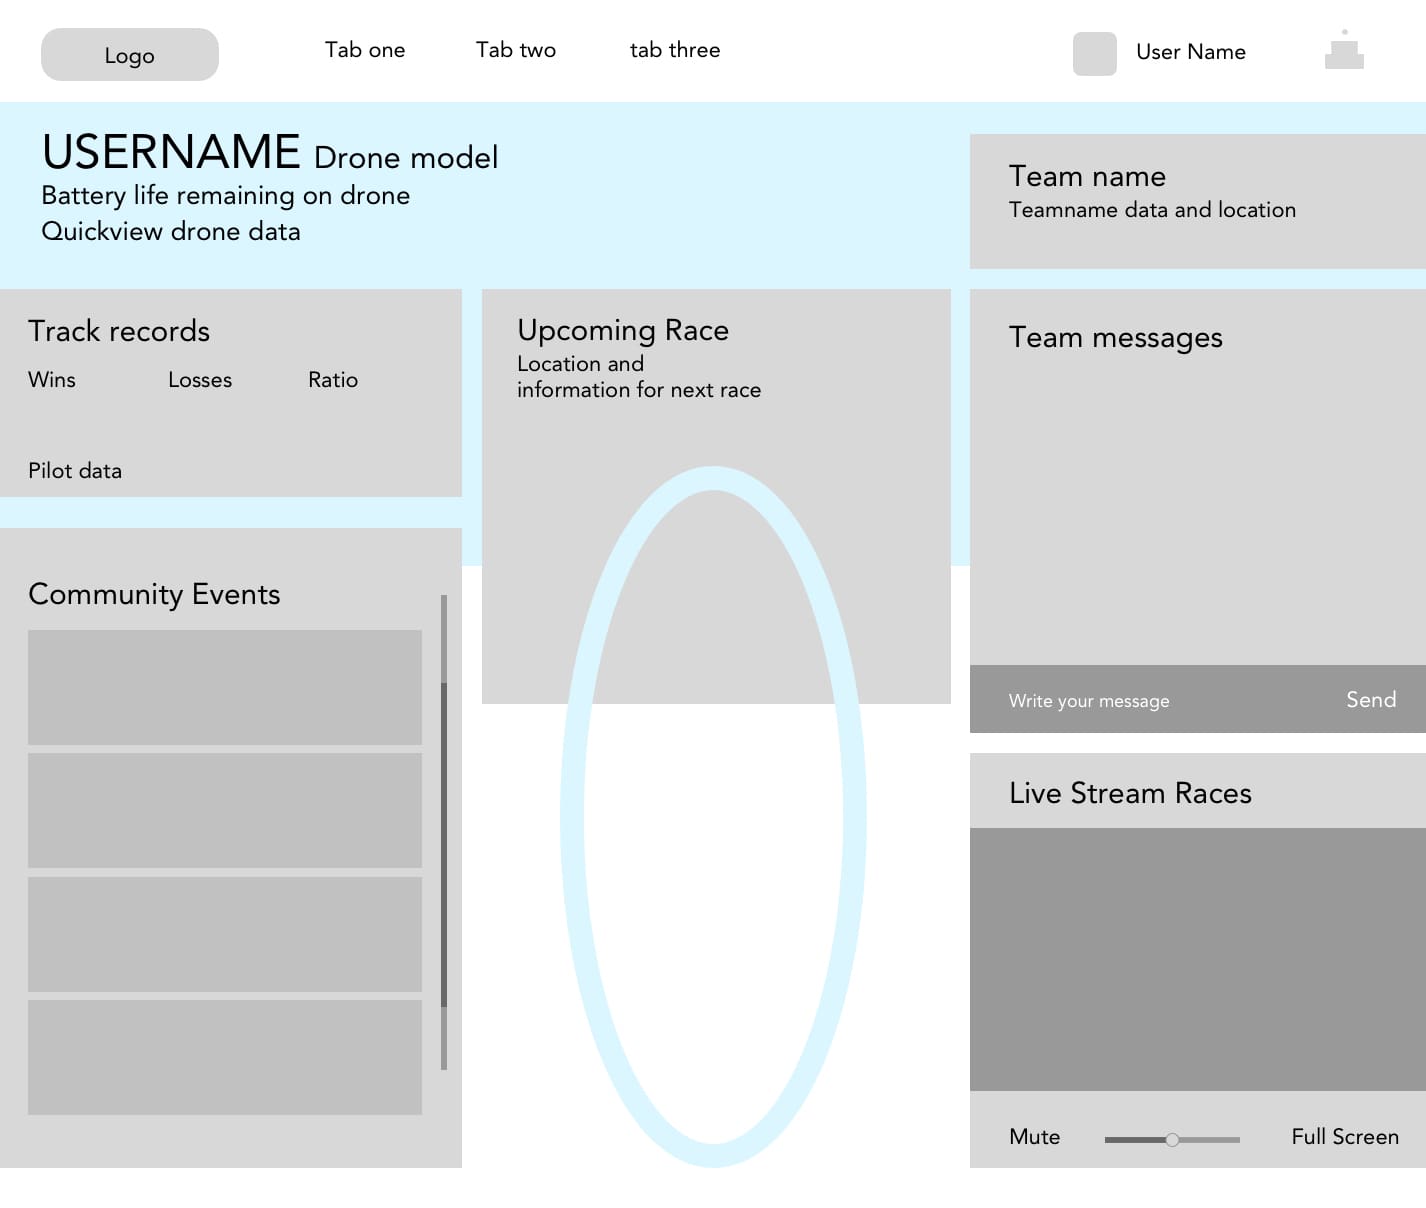
The approach was to introduce a gamification profile where users could see their profile and feel like all the information was personalized for them. That started with the navigation bar, letting the user set a profile picture as well as display their username on the top.
Users would see their most important information naturally at the top and then move downward for their interactive elements. The heat map showed the most comfortable spot for users often sat towards the bottom of the screen.
With that finding, it was decided best to layout and assign all clickable elements towards the bottom of the desktop app.
Home Dashboard
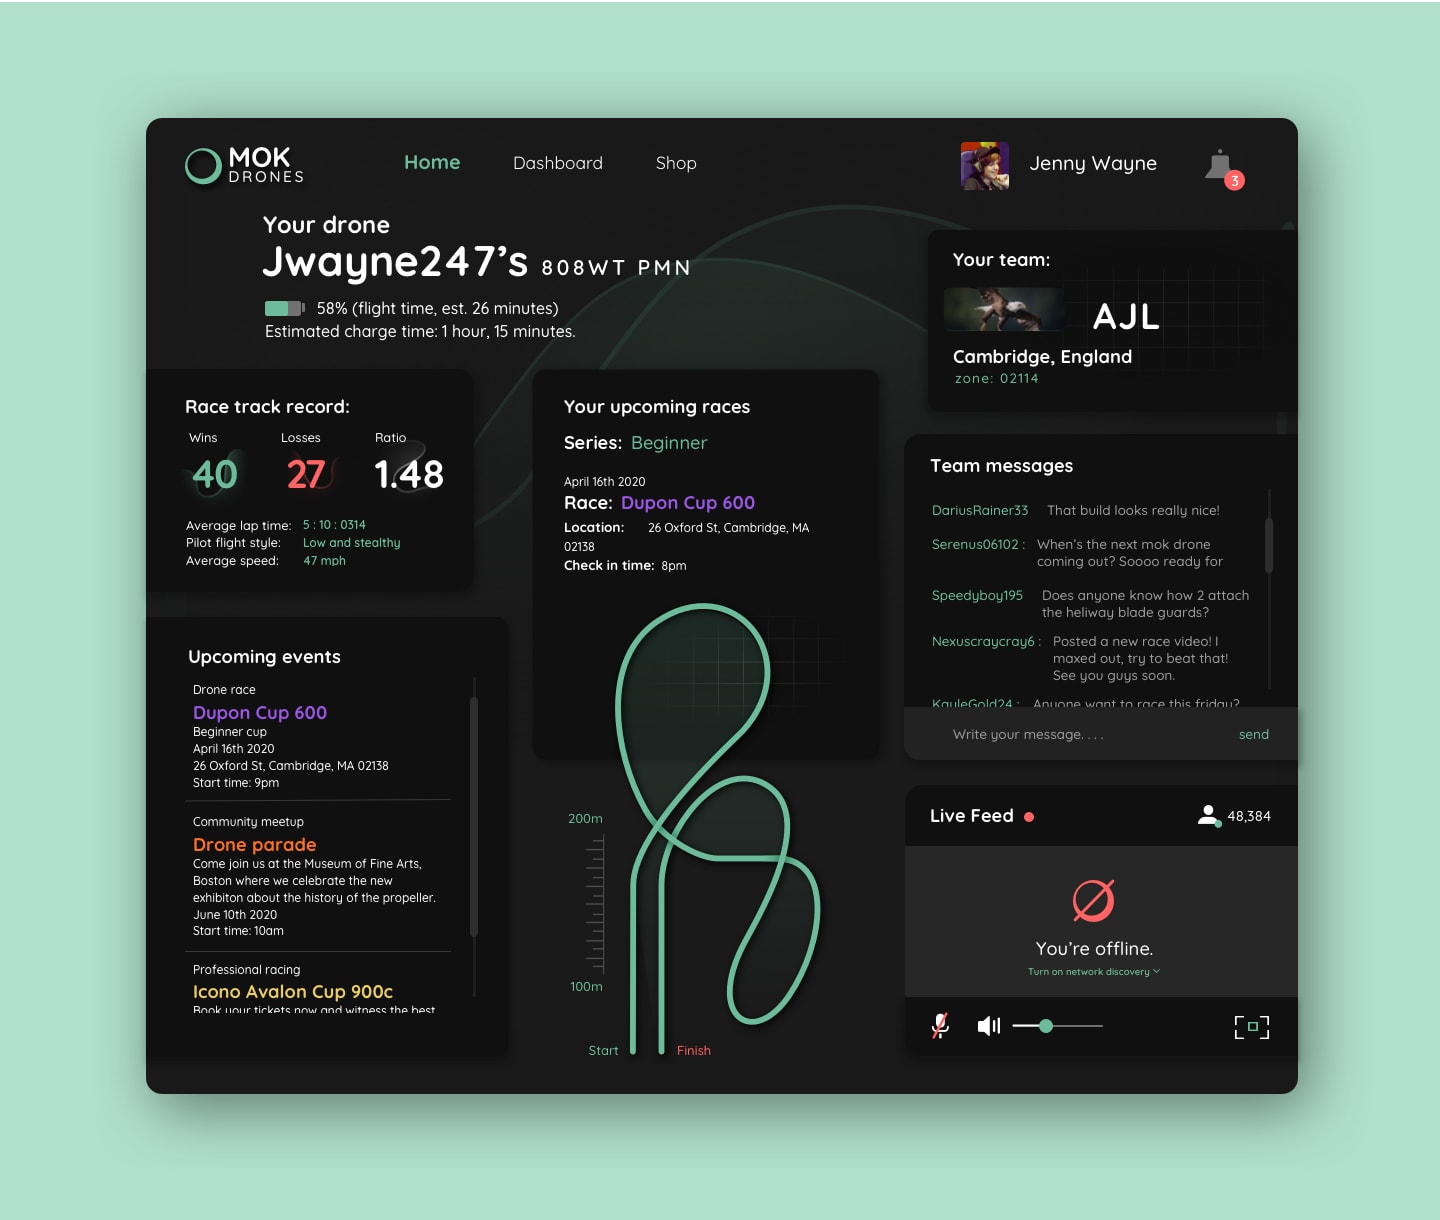
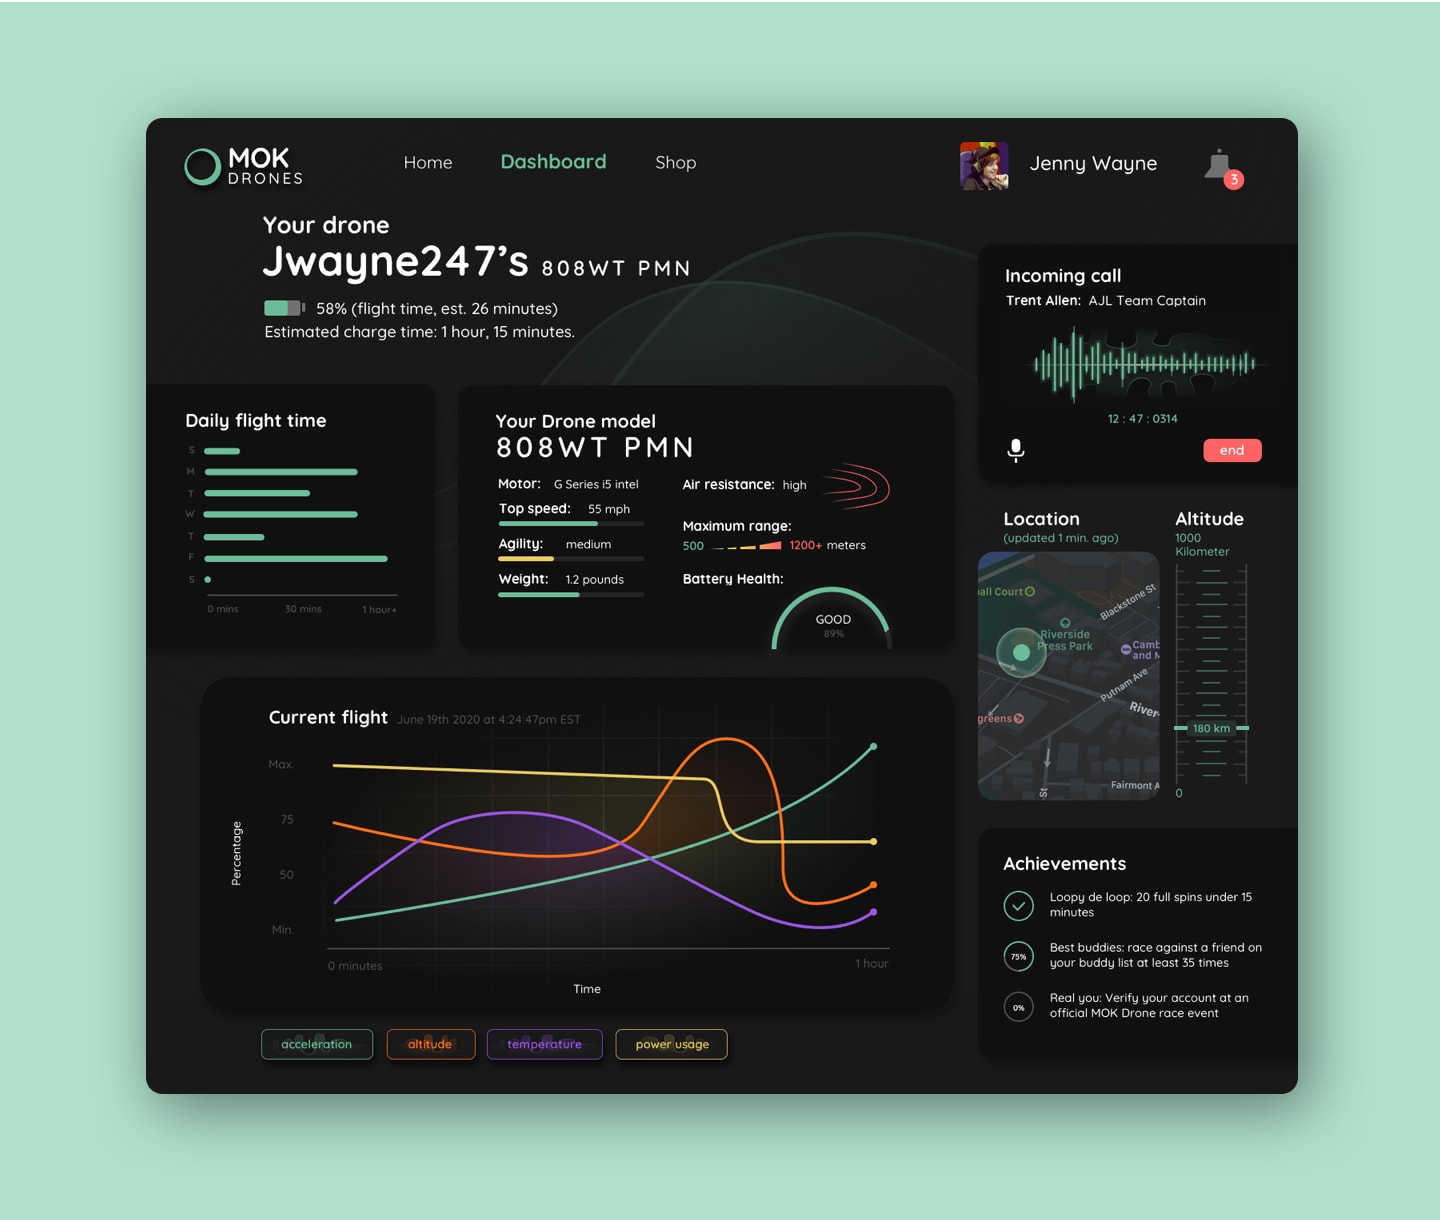
Profile live data screen. Building from the home dashboard, to keep brand consistency, the three-column system was adopted with the challenge to include the graph data.
The number of large scale metrics required more space than any other module in the dashboard. The voice call module placed at the top is an exception to the findings because of the attention needed with an incoming call. Any pilot or user that receives a call would reciprocate and acknowledge that specific module when surrounded by static elements.
Organizing the essential information for pilots and ensuring each flight variable was designed to be quickly viewed, made for racing. One of the challenges was how most information could be translated into digestible bits of data points. An essential design factor was to make sure the pilot could find the information they needed at a moment's notice without having to look everywhere on the dashboard.
Live Data Dashboard